“The connection works, but the health check keeps failing.”
I ran into this problem while migrating a service to an on-premises K3s cluster that connects to AWS ElastiCache (Redis) over Tailscale VPN. Pods wouldn’t transition to the Ready state after deployment. The Redis connection itself succeeded, simple commands like HELLO and CLIENT responded normally — but the response to the INFO command, used by the health check, simply disappeared. It was a baffling situation.
The root cause turned out to be MTU (Maximum Transmission Unit). Small packets passed through the VPN tunnel just fine, but larger packets, after encapsulation, exceeded the physical NIC’s MTU and got dropped. A classic symptom.
To be honest, I’d heard of MTU before but never actually encountered it in the wild. That’s why I didn’t catch on right away that the behavior was varying based on packet size. I spent a while going down the wrong path — running repeated ping and DNS resolution checks at the node level and Pod level, thinking it was just a connectivity issue.
This post walks through the troubleshooting process, covers the core concepts behind MTU and MSS, and explains how I ultimately resolved the issue using MSS Clamping and Flannel MTU configuration.
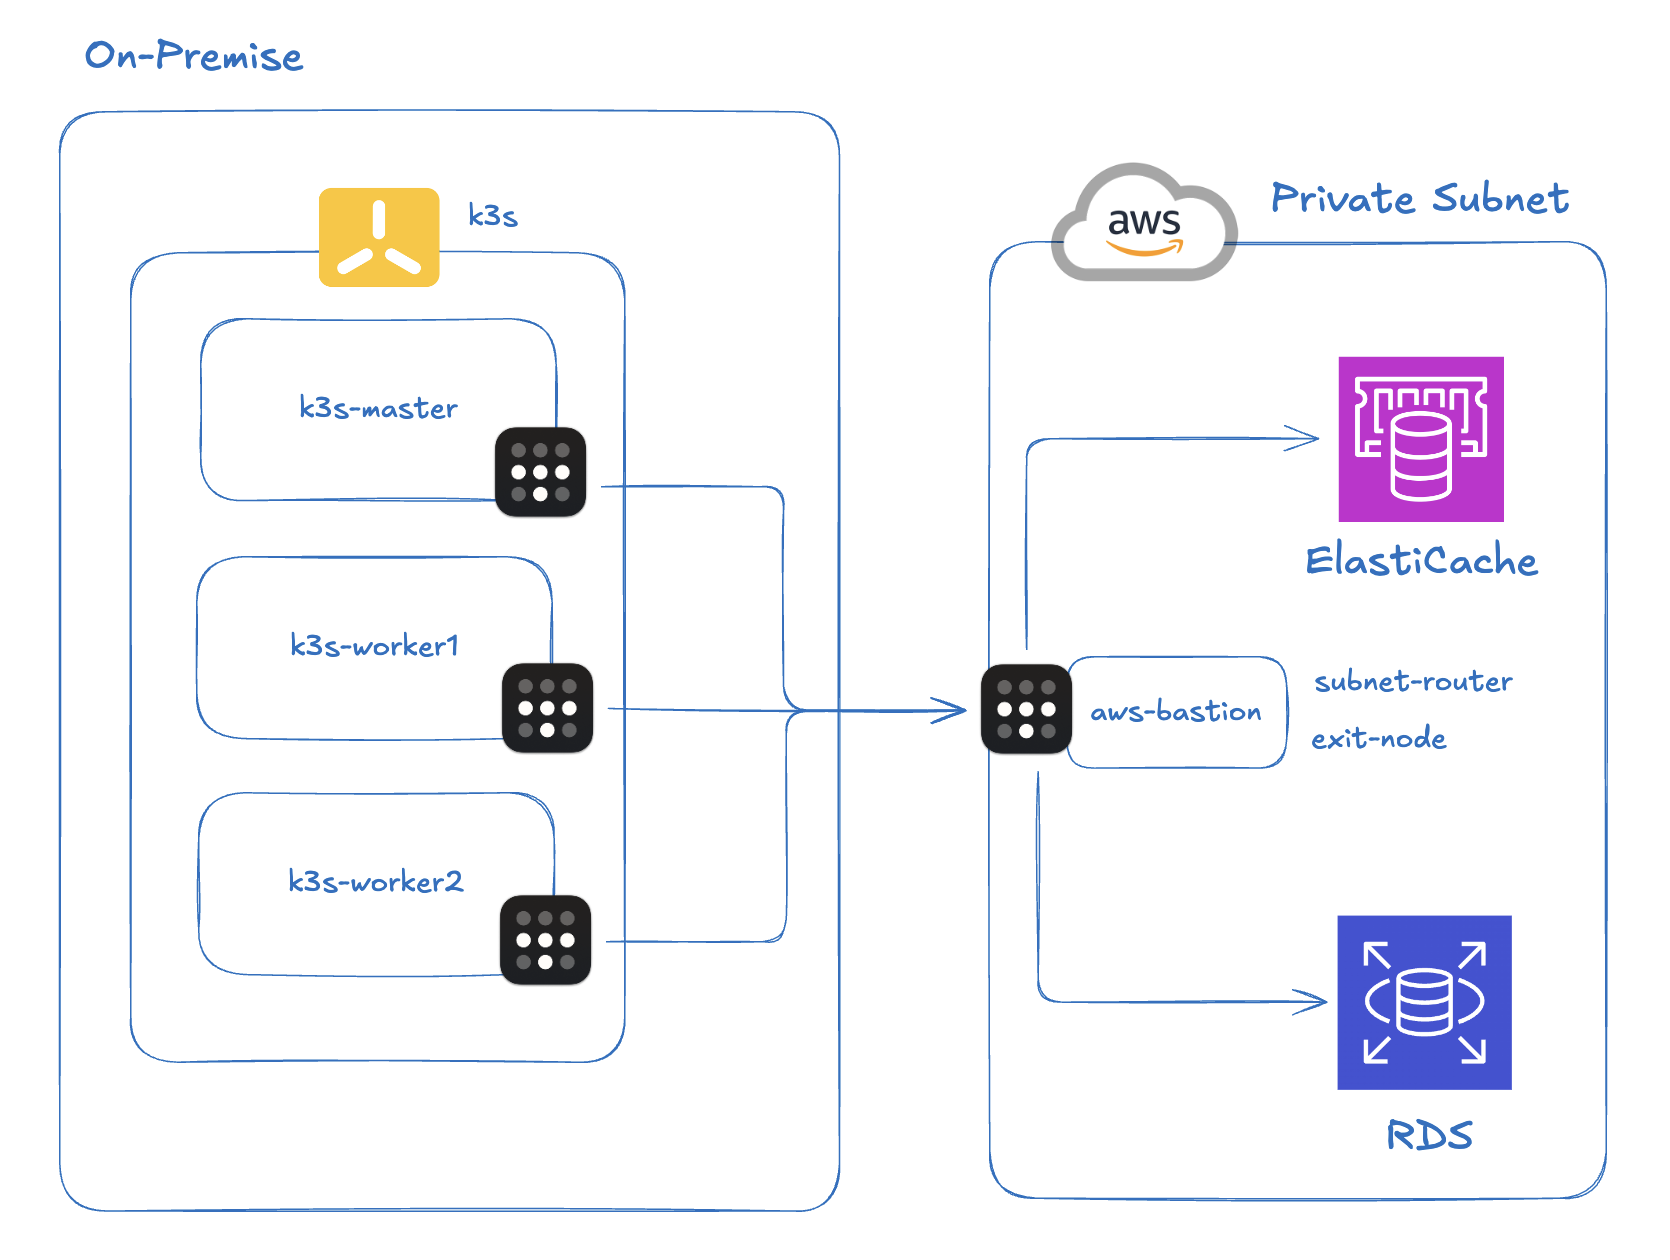
1. Infrastructure Setup
Here’s the environment where the problem occurred.
K3s cluster: A lightweight Kubernetes cluster built on-premises with K3s. Pod CIDR is
10.42.0.0/16.VPN: Tailscale (a WireGuard-based mesh VPN). To reach the AWS private subnet, I installed Tailscale on a bastion EC2 instance and configured it as a Subnet Router, advertising the VPC CIDR. All on-premises nodes also have Tailscale installed.
AWS ElastiCache: A Redis 7.1 instance in a private subnet. Only accessible via the EC2 bastion, which means on-premises traffic must go through the Tailscale tunnel.
Application: A Spring Boot (Kotlin) notification service, deployed via ArgoCD, connecting to ElastiCache using the Lettuce client. This issue surfaced while migrating the service from AWS ECS to on-premises.
The key path in this setup is: on-premises Pod → Tailscale tunnel → Redis in AWS private subnet. Packets from a Pod travel through Flannel’s VXLAN layer to reach the node, then traverse Tailscale’s WireGuard tunnel to reach AWS. In other words, encapsulation happens twice.
2. The Problem: Redis Health Check Failures
When I deployed the notification service via ArgoCD, Pods wouldn’t transition to Ready. The Spring Boot app itself started up in about 13 seconds, and the TCP connection to Redis succeeded. But the Spring Boot Actuator Redis health check kept failing, leaving Pods stuck in Not Ready.
At first I assumed there was a general network problem. I suspected ElastiCache DNS wasn’t resolving correctly, so I worked my way up from the node level to the Pod level checking connectivity. Everything looked fine — even TCP port 6379 was reachable via ping.
A closer look at the logs revealed an interesting pattern.
Normal: HELLO / CLIENT commands
01:22:20.983 [lettuce-nioEventLoop-6-1] DEBUG CommandHandler
  - write(ctx, AsyncCommand [type=HELLO, ...])
01:22:21.039 [lettuce-nioEventLoop-6-1] DEBUG CommandHandler
  - Received: 150 bytes, 1 commands in the stack
01:22:21.051 [lettuce-nioEventLoop-6-1] DEBUG CommandHandler
  - Completing command [type=HELLO, output={server=redis, version=7.1.0, proto=3, ...}]

01:22:21.053 [lettuce-nioEventLoop-6-1] DEBUG CommandHandler
  - write(ctx, [AsyncCommand [type=CLIENT, ...], AsyncCommand [type=CLIENT, ...]])
01:22:21.062 [lettuce-nioEventLoop-6-1] DEBUG CommandHandler
  - Received: 10 bytes, 2 commands in the stack
01:22:21.063 [lettuce-nioEventLoop-6-1] DEBUG CommandHandler
  - Completing command [type=CLIENT, output=OK]
Notice that the failure is in the health check itself, not a connection timeout. HELLO (150B) and CLIENT (10B) both produce normal Completing command log entries.
Abnormal: INFO command — no response
01:22:21.085 [http-nio-8081-exec-3] DEBUG RedisChannelHandler
  - dispatching command AsyncCommand [type=INFO, ...]
01:22:21.089 [lettuce-nioEventLoop-6-1] DEBUG CommandEncoder
  - writing command AsyncCommand [type=INFO, ...]
# ⚠️ No Received log follows — response never arrives

01:22:30.582 [http-nio-8081-exec-4] DEBUG RedisChannelHandler
  - dispatching command AsyncCommand [type=INFO, ...]
# ⚠️ No Received log — retrying every 10 seconds

01:22:40.623 ... [type=INFO, ...] # ⚠️ No response
01:22:50.664 ... [type=INFO, ...] # ⚠️ No response
01:23:00.705 ... [type=INFO, ...] # ⚠️ No response
The INFO command gets as far as writing command, but the Received log never appears. No response comes back at all. The client retries every 10 seconds, always with the same result.
The Pattern: Whether Packets Make It Through Depends on Their Size
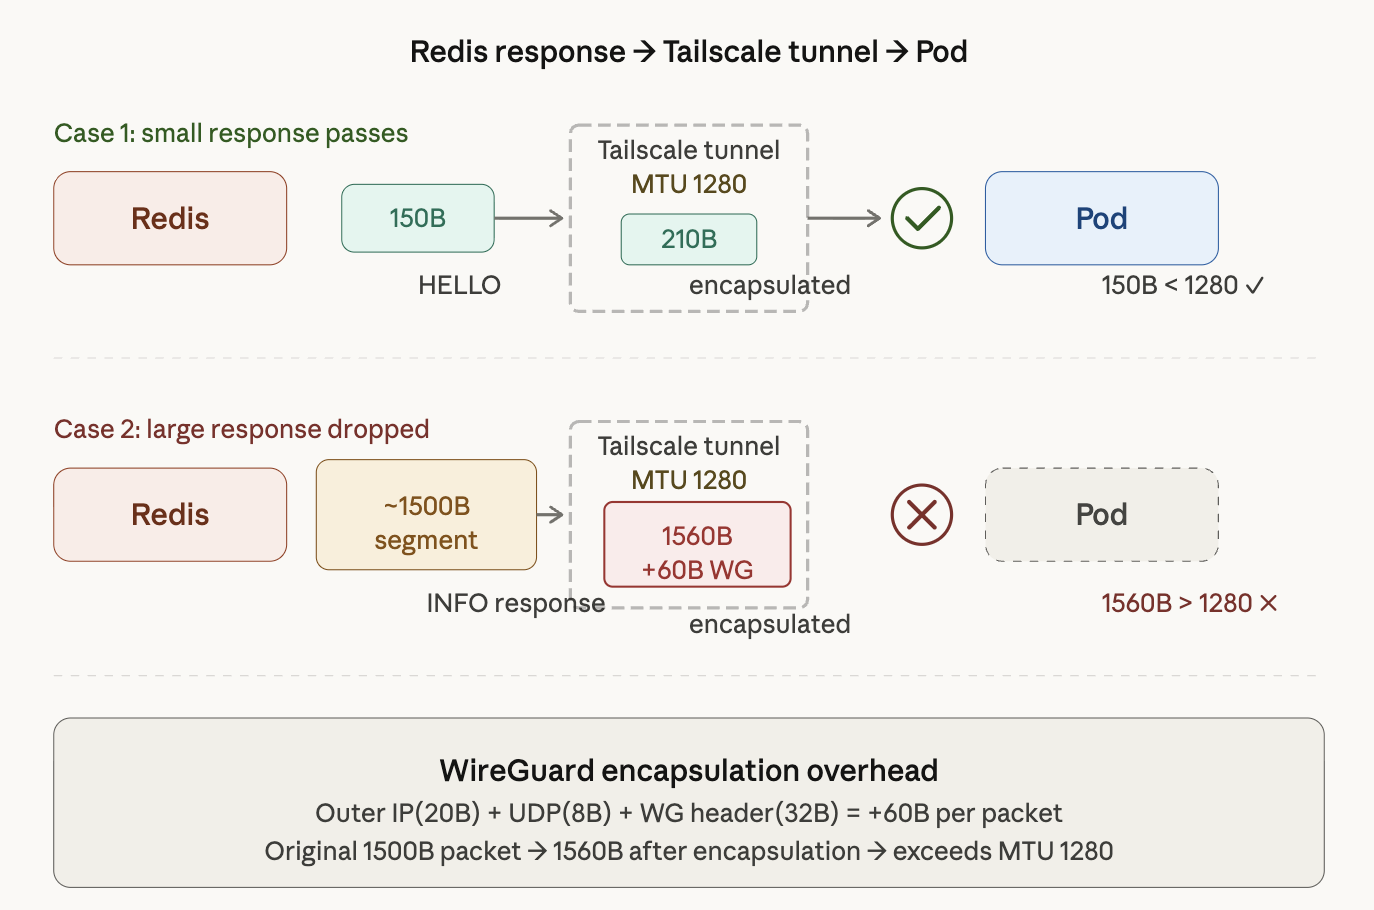
The diagram above shows two scenarios for how a Redis response reaches a Pod through the Tailscale tunnel.
Case 1: Small responses get through. The HELLO command’s 150B response becomes roughly 210B after encapsulation — well under Tailscale’s MTU of 1280. The packet reaches the Pod without issue (150B < 1280).
Case 2: Large responses get dropped. The INFO command response comes back in ~1500B segments. Adding WireGuard’s 60B encapsulation overhead brings that to 1560B, which exceeds Tailscale’s MTU of 1280. The packet is dropped, and the Pod waits forever for a response that will never come.
Small packets pass. Large packets vanish. That was the crucial clue. Once I noticed that success and failure split along packet size lines, MTU became the obvious suspect.
3. Tracking Down the Cause: The MTU Hypothesis
Behavior that splits along packet size lines is a classic symptom of MTU problems. I considered other possibilities, but they didn’t hold up.
- Redis ACL / permission issue? → A permission error would return an error response. No response at all points to a network-level problem.
- Redis under heavy load? → INFO is a lightweight command. A server-side problem would affect all commands.
- Tailscale misconfiguration? → RDS in the same security group was connecting normally.
To confirm the MTU hypothesis, I ran a ping test from a worker node with the DF (Don’t Fragment) bit set.
uoslife@k3s-worker2:~$ ping -M do -s 1400 10.128.168.231
PING 10.128.168.231 (10.128.168.231) 1400(1428) bytes of data.
ping: local error: message too long, mtu=1280
ping: local error: message too long, mtu=1280
ping: local error: message too long, mtu=1280
-M do sets the DF bit, and -s 1400 sets the ICMP payload size to 1400 bytes. The result immediately fails with message too long, mtu=1280. That’s because 1400 + 28 (IP 20B + ICMP 8B) = 1428 bytes exceeds the Tailscale interface’s MTU of 1280.
uoslife@k3s-worker2:~$ ping -M do -s 1200 10.128.168.231
PING 10.128.168.231 (10.128.168.231) 1200(1228) bytes of data.
# Packet goes through (1228 < 1280)
Reducing to 1200 bytes lets the packet through. This confirmed that the Tailscale interface (tailscale0) has an MTU of 1280. Now let’s look at why that causes a problem.
4. Background: MTU and Related Concepts
This section pauses the troubleshooting narrative to cover the key concepts around MTU.
4.1 MTU and MSS
MTU (Maximum Transmission Unit) is the maximum size of a packet that a network interface can transmit in a single operation. More precisely, it’s the maximum size of an L2 frame’s payload — that is, the maximum size of an L3 (IP) packet. The standard Ethernet MTU is 1500 bytes.
To understand this fully, it helps to look at the data units at each OSI layer. The diagram below illustrates this.
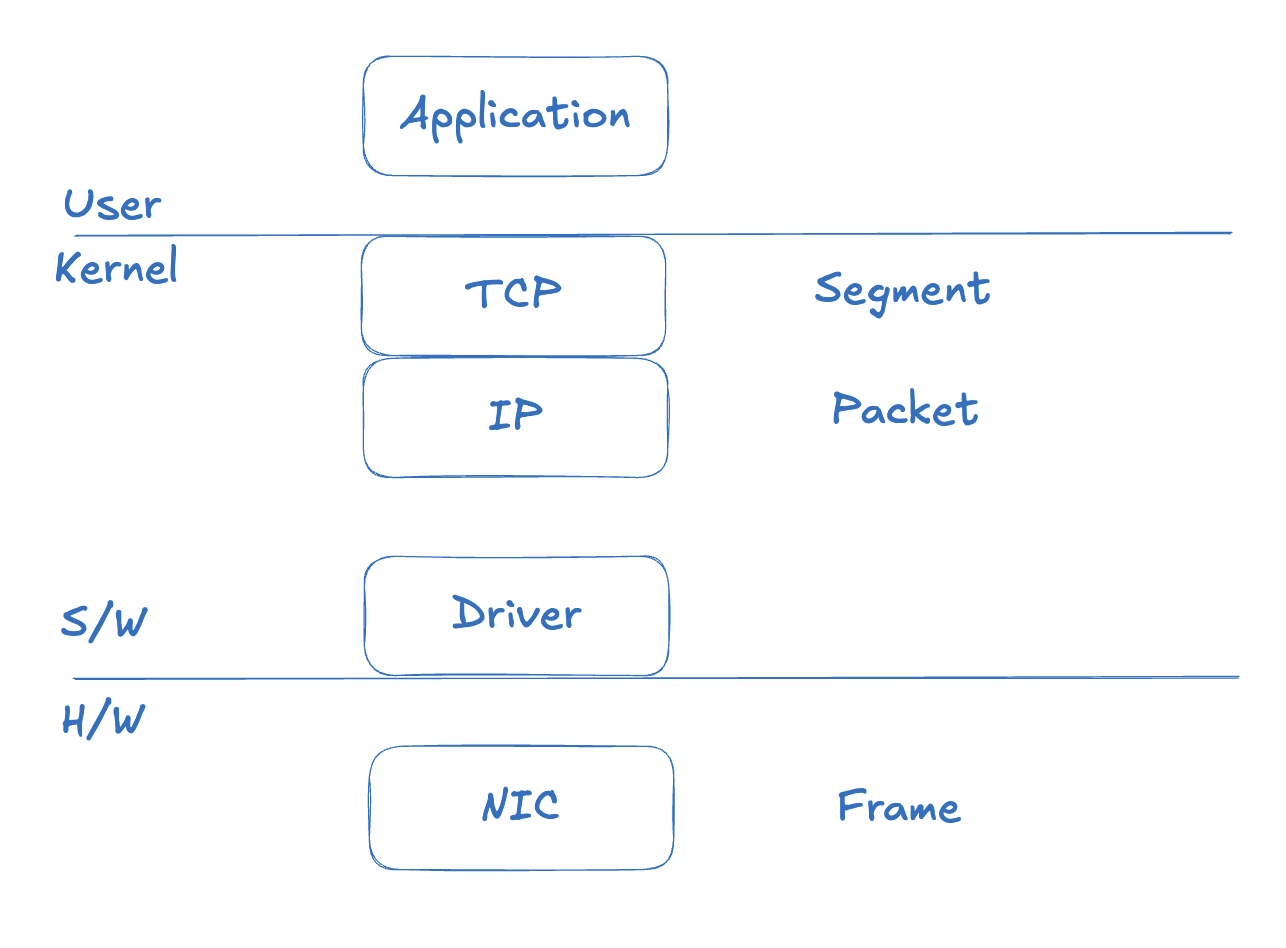
At the TCP layer the unit is a Segment, at the IP layer it’s a Packet, and at the data link layer (NIC) it’s a Frame. As data moves down the stack, headers are added at each layer.
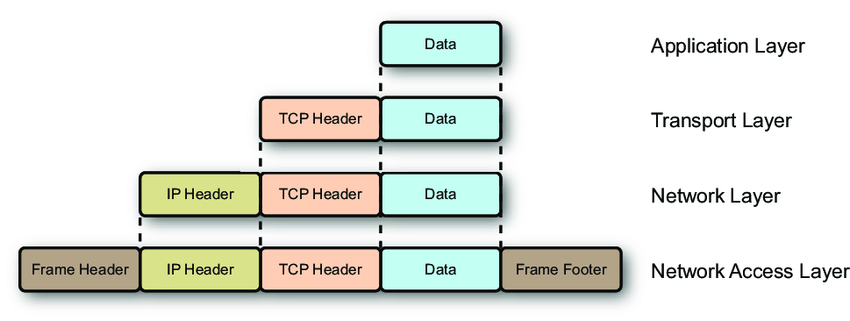
With an MTU of 1500 bytes, subtracting the IP header (20B) and TCP header (20B) leaves a payload of at most 1460 bytes. Note that the Ethernet frame header (14B) and FCS (4B) are not counted in the MTU — MTU only counts from L3 up.
This brings us to an important concept: MSS (Maximum Segment Size). MSS is the maximum amount of application data that can fit in a single TCP segment — it’s the MTU minus the IP header and TCP header.
MSS = MTU - IP Header - TCP Header
MSS = 1500 - 20 - 20 = 1460 bytes
During the TCP 3-way handshake, each side negotiates MSS based on its outgoing interface’s MTU. When an application wants to send 10KB of data, TCP breaks it into segments of MSS size.
4.2 Fragmentation and the DF Bit
When a packet exceeds the MTU somewhere along the path, one of two things can happen.
Scenario 1: Fragmentation
If the DF (Don’t Fragment) bit in the IP header is off, a router can split the packet into smaller pieces to fit within the MTU and forward them. The receiver reassembles them, but this degrades performance and if any fragment is lost, the entire packet must be retransmitted.
Scenario 2: Drop + ICMP error
If the DF bit is set (which is true for most modern TCP packets), the router drops the packet and returns an ICMP “Fragmentation Needed” message. The sender receives this message and retransmits with a smaller packet size. This is the Path MTU Discovery (PMTUD) mechanism.
However, in VPN or firewall environments, ICMP is often blocked, which prevents PMTUD from working. The sender has no way of knowing why the packet was dropped and ends up waiting for a timeout. This is called a PMTUD Black Hole.
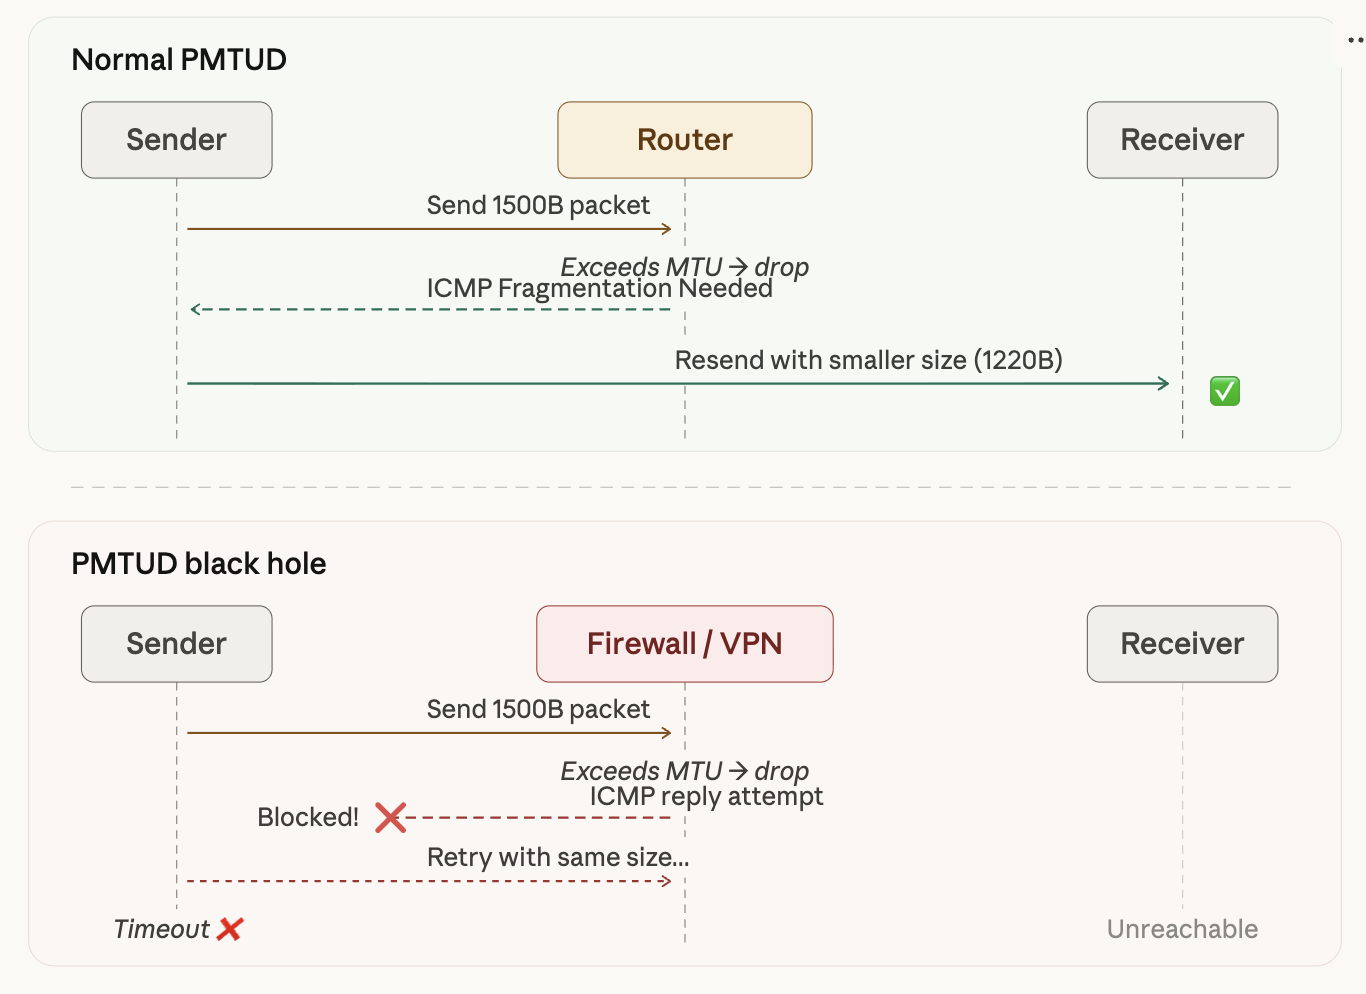
As the diagram shows, with normal PMTUD the router uses ICMP to inform the sender of the MTU limit, and the sender retransmits with a smaller packet. In a VPN/firewall environment, ICMP is blocked, the sender has no idea why packets are being dropped, and eventually times out while retrying with the same oversized packet.
4.3 WireGuard (Tailscale) Double Encapsulation
Here’s the crux of the problem. WireGuard is an L3 VPN that encapsulates entire IP packets. This adds roughly 60 bytes of overhead.
WireGuard overhead: Outer IP (20B) + UDP (8B) + WG Header (32B) = 60B
Walking through the encapsulation step by step:
Step 1: The app creates a packet
The application has no knowledge of the tunnel. It sends data as it normally would.
[Inner IP 20B] [Inner TCP 20B] [Payload 1460B] = 1500B
Step 2: WireGuard (Tailscale) encapsulates it
The original 1500B packet becomes the data payload, and new headers are wrapped around it.
[Outer IP 20B] [UDP 8B] [WG Header 32B] [Original packet 1500B] = 1560B
Step 3: The physical NIC rejects it
The physical NIC’s MTU is 1500B, but the encapsulated packet is 1560B. MTU exceeded → dropped.
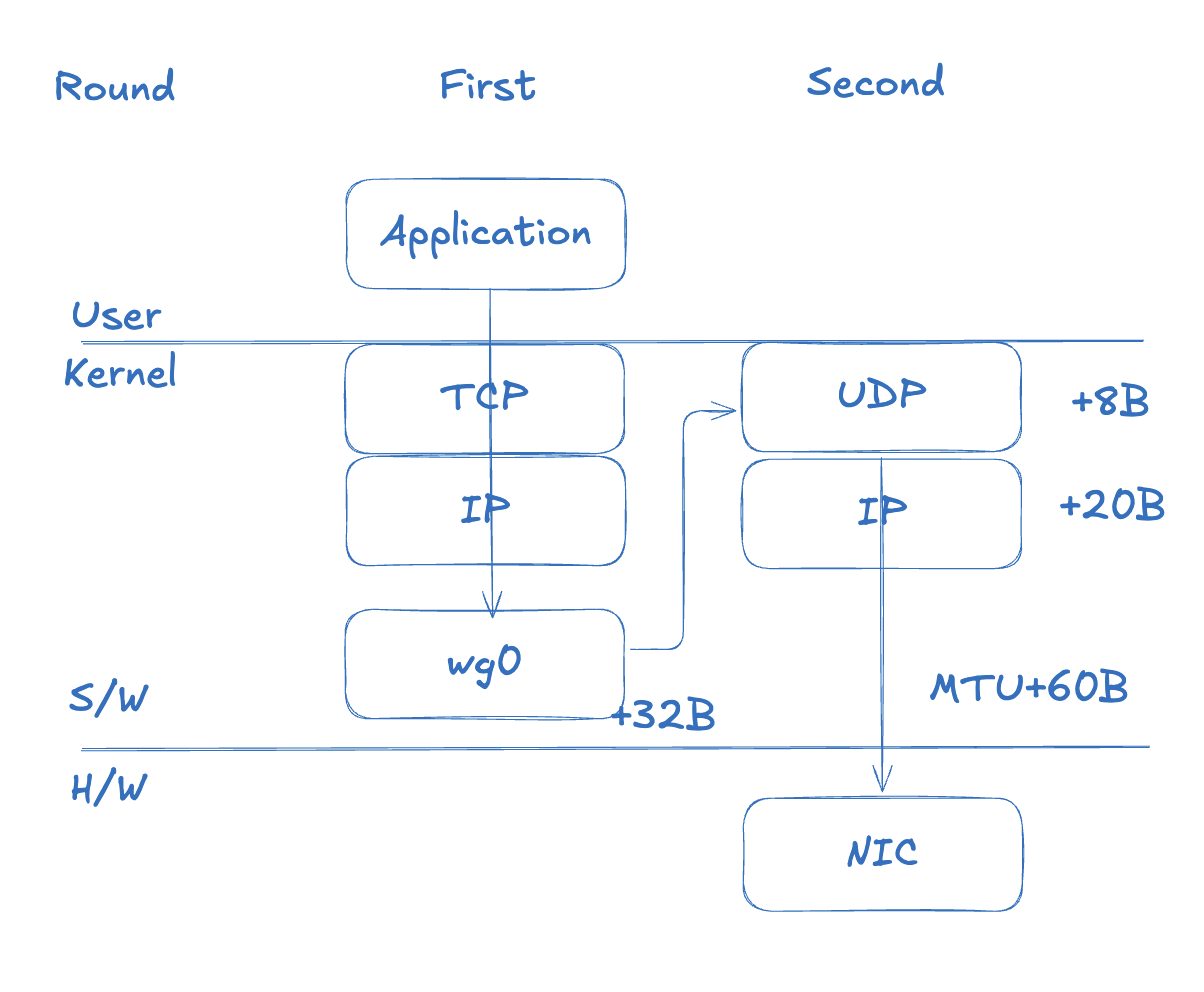
In a WireGuard-based VPN, packets travel through two layers. A 1500B packet produced by the TCP/IP stack arrives at the kernel’s WireGuard virtual interface (wg0, tailscale0). WireGuard encrypts the packet, adds a WG header (32B), and turns it into a new UDP payload. A UDP header (8B) and an outer IP header (20B) are added in turn, resulting in a final size of 1560B.
Unlike TCP, which calls its transmission unit a Segment, UDP calls its unit a Datagram.
To summarize, a WireGuard-encapsulated packet exceeds the MTU like this:
Regular packet:
  [IP 20B] [TCP 20B] [Payload 1460B] = 1500B
  → within physical NIC MTU ✅

After WireGuard encapsulation:
  [Outer IP 20B] [UDP 8B] [WG 32B]
    + [Inner IP 20B] [TCP 20B] [Payload 1460B]
  = 1560B
  → exceeds MTU ❌
Think of it like trying to put a fully-packed box into an international shipping box — but the outer box has the same size limit as the inner one, so it just won’t fit.
Why TCP Can’t Compensate on Its Own
TCP negotiates MSS based on the MTU of its outgoing interface. If the tunnel interface (tailscale0) has an MTU of 1500, TCP negotiates an MSS of 1460. The 60 bytes that WireGuard adds is outside TCP’s visibility. This is the fundamental trap of IP-in-UDP encapsulation.
What Actually Happened in Our Environment
Tailscale in our environment had set its MTU to 1280. This is a conservative value Tailscale uses for IPv6 minimum MTU compatibility. The problem was that the TCP stack inside the Pods wasn’t properly accounting for this value.
Redis PING (small packet):
  Inner: [IP+TCP+PING ≈ 50B] = 50B
  After encapsulation: 50 + 60 = 110B → ✅ passes through

Redis INFO response (large packet):
  Inner: [IP+TCP+INFO ≈ 1500B] = 1500B
  After encapsulation: 1500 + 60 = 1560B → ❌ dropped
Small responses like HELLO (150B) and CLIENT (10B) are still within the MTU after encapsulation — no problem. But the INFO response (~5KB) contains segments that exceed the MTU and get dropped. “The connection works, but the health check keeps failing” — that’s exactly what this looks like from the application’s perspective.
5. The Fix: MSS Clamping
With the root cause identified, the fix is straightforward: forcibly lower the TCP MSS to match the tunnel MTU. This technique is called MSS Clamping.
The iptables Rule
sudo iptables -t mangle -A FORWARD -o tailscale0 \
  -p tcp --tcp-flags SYN,RST SYN \
  -j TCPMSS --clamp-mss-to-pmtu
Here’s what each option does:
| Option | Description |
|---|---|
-t mangle | The mangle table (for packet modification) |
-A FORWARD | Apply to forwarded packets (Pod → external traffic) |
-o tailscale0 | Target packets going out through the tailscale0 interface |
-p tcp --tcp-flags SYN,RST SYN | Match only TCP SYN packets (during handshake) |
-j TCPMSS --clamp-mss-to-pmtu | Automatically adjust MSS to match the Path MTU |
This rule intercepts TCP SYN packets during the 3-way handshake and adjusts the MSS value to fit within the tailscale0 interface’s MTU (1280). As a result, ElastiCache will split its responses into smaller segments when sending data back.
Results Immediately After Applying
01:38:20.012 [http-nio-8081-exec-2] DEBUG RedisChannelHandler
  - dispatching command AsyncCommand [type=INFO, ...]
01:38:20.014 [lettuce-nioEventLoop-6-1] DEBUG CommandEncoder
  - writing command AsyncCommand [type=INFO, ...]
01:38:20.022 [lettuce-nioEventLoop-6-1] DEBUG CommandHandler
  - Received: 1024 bytes, 1 commands in the stack
01:38:20.022 [lettuce-nioEventLoop-6-1] DEBUG RedisStateMachine
  - Decode done, empty stack: false
01:38:20.022 [lettuce-nioEventLoop-6-1] DEBUG CommandHandler
  - Received: 4175 bytes, 1 commands in the stack
01:38:20.023 [lettuce-nioEventLoop-6-1] DEBUG RedisStateMachine
  - Decode done, empty stack: true
01:38:20.023 [lettuce-nioEventLoop-6-1] DEBUG CommandHandler
  - Completing command [type=INFO, output=# Server redis_version:7.1.0 ...]
01:38:20.024 [http-nio-8081-exec-2] DEBUG RedisConnectionUtils
  - Closing Redis Connection
The INFO response now arrives split across multiple TCP segments. The first Received: 1024 bytes is followed by Decode done, empty stack: false (more data expected), and the second Received: 4175 bytes finishes with Decode done, empty stack: true (decoding complete). A total of roughly 5,199 bytes received successfully.
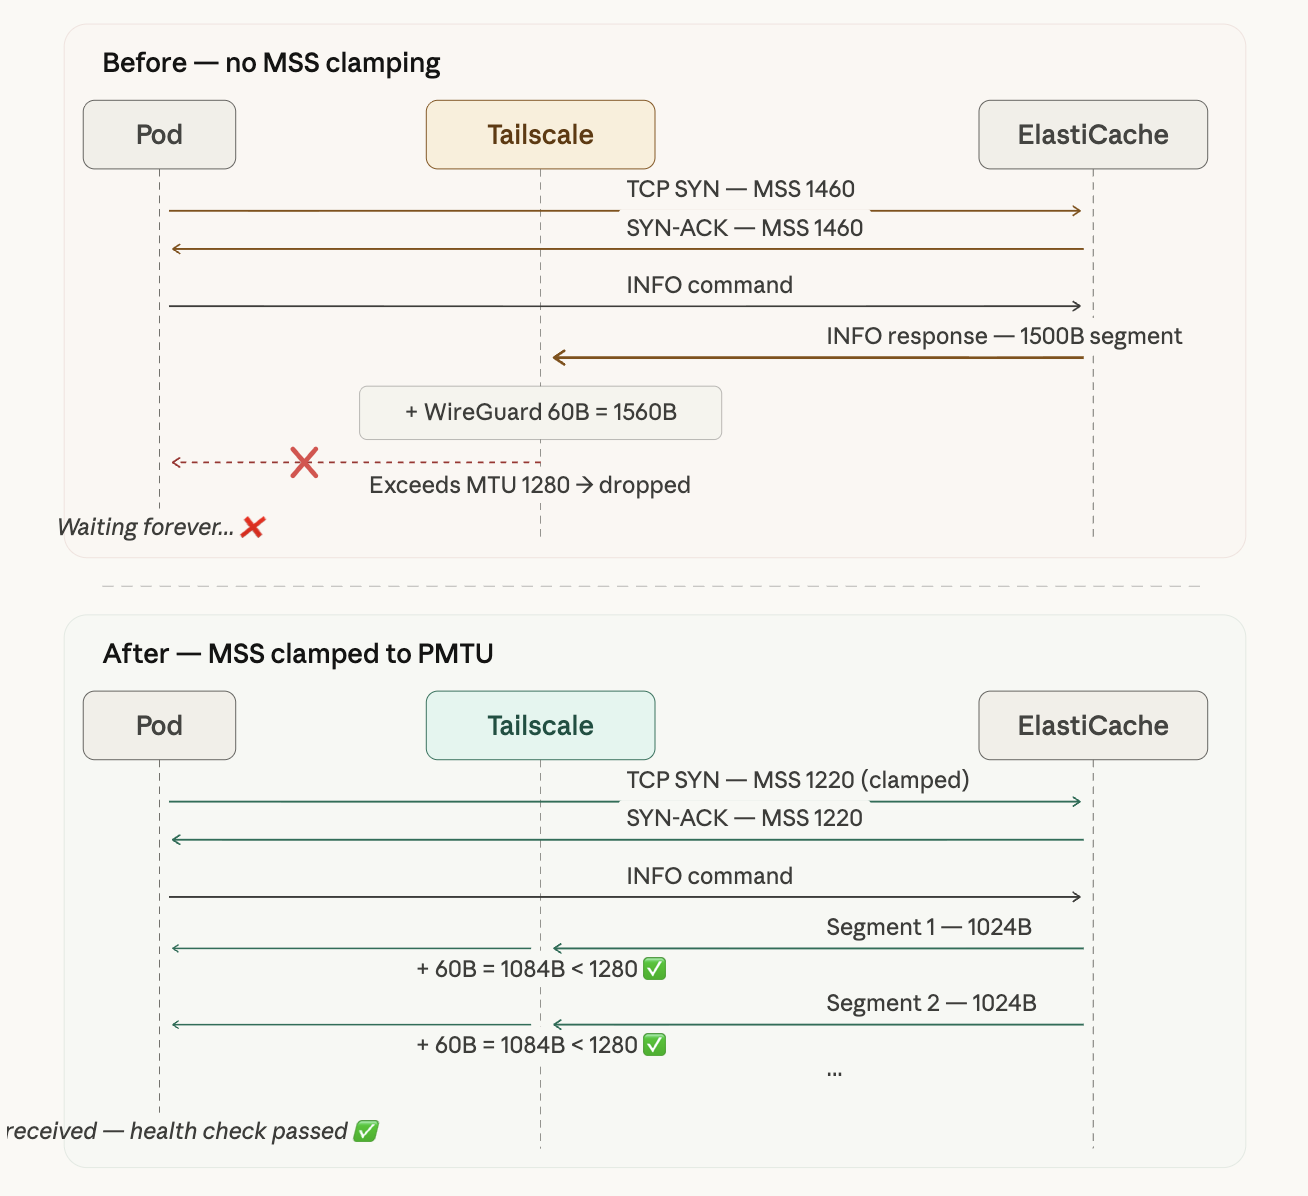
The diagram above illustrates the difference. Before clamping, MSS is negotiated at 1460, the INFO response comes down as a single 1500B segment, and after encapsulation it becomes 1560B and gets dropped. After clamping, MSS is reduced to 1220, the INFO response is split into smaller ~1024B segments, and each one passes through the tunnel within the 1280B MTU limit.
Before and After
| Before | After | |
|---|---|---|
| HELLO (150B) | ✅ received normally | ✅ received normally |
| CLIENT (10B) | ✅ received normally | ✅ received normally |
| INFO (~5KB) | ❌ response dropped | ✅ received as 1024B + 4175B segments |
| Health check | ❌ failing (Pod Not Ready) | ✅ passing (Pod Ready) |
6. Second Problem: A Different Worker Node
With the first Pod healthy, I thought I was done — but the second Pod replica still wasn’t becoming Ready.
The reason was simple. I had applied MSS Clamping only to k3s-worker2, and the second Pod happened to be scheduled on a different worker node. iptables rules are per-node and don’t propagate automatically.
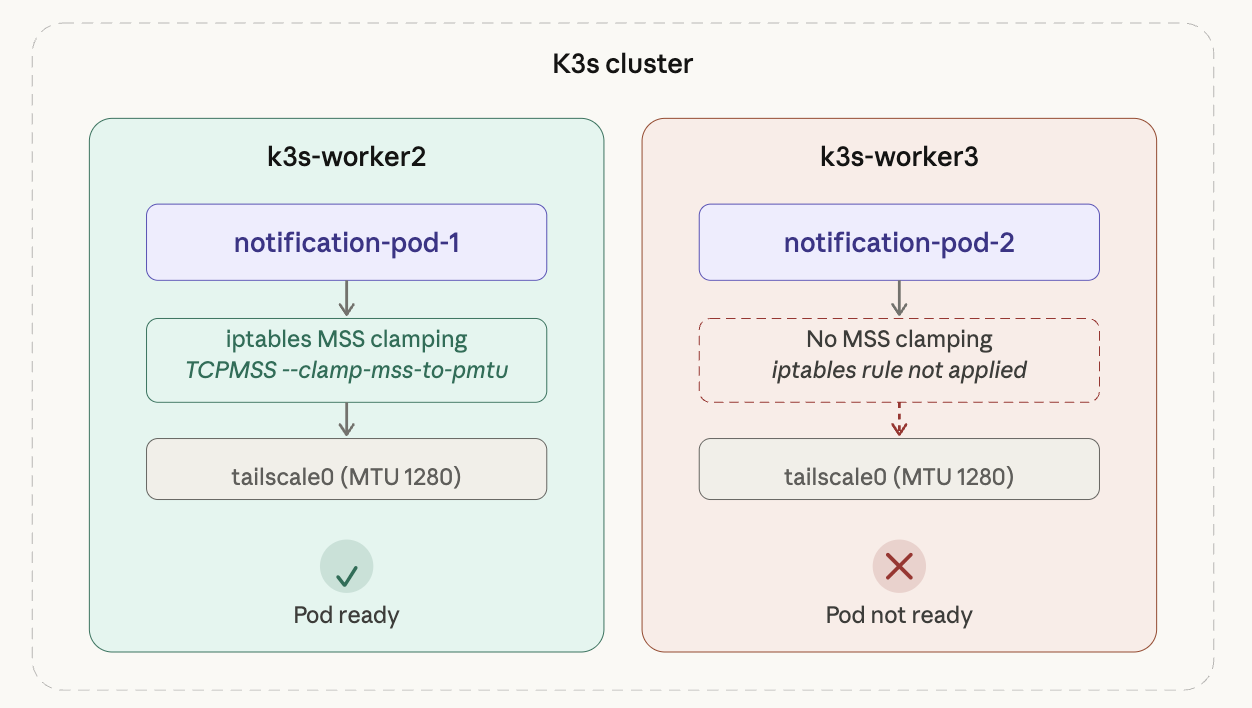
k3s-worker2 had the rule applied so its Pod was Ready, but k3s-worker3 had no rule, reproducing the exact same problem.
# Check which node each Pod is scheduled on
kubectl get pods -n <namespace> -o wide | grep notification
The fix is simple: apply the same iptables rule to every worker node.
# Run on all worker nodes
sudo iptables -t mangle -A FORWARD -o tailscale0 \
  -p tcp --tcp-flags SYN,RST SYN \
  -j TCPMSS --clamp-mss-to-pmtu
After applying it everywhere, the second Pod transitioned to Ready as well.
In Kubernetes, network configuration lives at the node level. Since you can’t predict which node a Pod will be scheduled on, any network-related configuration must be applied consistently across all nodes.
7. Making It Permanent
The Problem: iptables Rules Don’t Survive Reboots
Rules applied via iptables commands exist only in memory. If a node reboots, the rules are gone and the problem comes back. The worker nodes actually had *** System restart required *** messages waiting when I SSH’d in, so making this permanent was essential.
Option 1: iptables-persistent
The simplest approach is to install iptables-persistent and save the current rules.
sudo apt install iptables-persistent
sudo netfilter-persistent save
Option 2: Fix the Root Cause with Flannel MTU
MSS Clamping is more of a band-aid. The proper fix is to set Flannel’s MTU to match the Tailscale tunnel MTU.
On the server (master) node, /etc/rancher/k3s/config.yaml:
flannel-conf: /etc/rancher/k3s/flannel.json
/etc/rancher/k3s/flannel.json:
{
  "Network": "10.42.0.0/16",
  "EnableIPv4": true,
  "EnableIPv6": false,
  "Backend": {
    "Type": "vxlan",
    "VNI": 1,
    "Port": 8472,
    "MTU": 1220
  }
}
The MTU of 1220 is calculated as follows:
Tailscale tunnel MTU:  1280
- VXLAN overhead:        50
- Buffer:                10
────────────────────────────
Flannel MTU:           1220
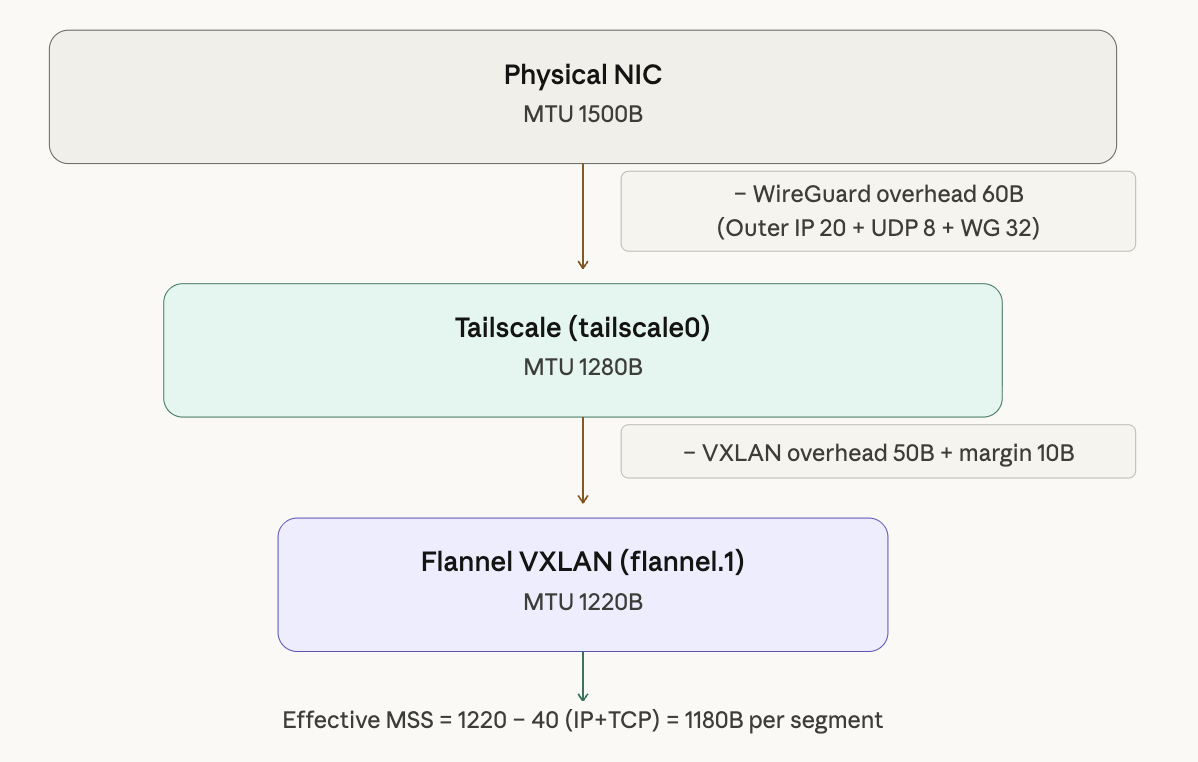
Starting from the physical NIC (1500B), subtract WireGuard overhead (60B) to get Tailscale MTU 1280. Subtract VXLAN overhead (50B) and a buffer (10B) to arrive at Flannel MTU 1220. With this value set, packets from Pods can pass through every encapsulation layer without issue.
Applying the Changes
# 1. Check current Flannel configuration
cat /var/lib/rancher/k3s/agent/etc/flannel/net-conf.json

# 2. Create the config file and restart k3s (master)
sudo systemctl restart k3s

# 3. Restart worker nodes
sudo systemctl restart k3s-agent

# 4. Verify Flannel MTU
ip link show flannel.1

# 5. Rollout restart existing Pods (new MTU only applies to new Pods)
kubectl rollout restart deployment/<deployment-name> -n <namespace>
One important caveat: changing Flannel MTU does not take effect immediately on already-running Pod veth interfaces. After making the change, existing Pods must be rollout restarted to pick up the new MTU. This affects all running workloads, so plan to do it during a maintenance window.
8. Retrospective
Lessons Learned
Here’s what I took away from this troubleshooting experience:
- “Small packets work, large packets don’t” → suspect MTU. The pattern of a working connection with failing data transfers is a textbook MTU symptom.
- Always account for double encapsulation in VPN tunnel environments. WireGuard adds 60B, VXLAN adds 50B — factor in the overhead for each encapsulation layer.
- Kubernetes network configuration is node-level. iptables rules don’t propagate automatically; they must be applied consistently to every node.
- Distinguish between the quick fix (MSS Clamping) and the proper fix (MTU configuration). In an outage, unblocking things fast comes first — but always follow up with a permanent solution.
Debugging Command Reference
# Check MTU: ping with DF bit set
ping -M do -s 1400 <target-ip>

# Check MTU per interface
ip link show tailscale0
ip link show flannel.1

# Verify MSS Clamping is applied
sudo iptables -t mangle -L FORWARD -v
WireGuard Protocol Appendix
For reference, here’s a comparison of WireGuard’s key characteristics against OpenVPN:
| WireGuard | OpenVPN | |
|---|---|---|
| Transport layer | UDP (always) | TCP or UDP |
| Operating level | Kernel module | Userspace |
| Codebase size | ~4,000 lines | ~hundreds of thousands of lines |
| Cipher negotiation | None (fixed) | TLS-based negotiation |
There’s a good reason WireGuard always uses UDP. If both the inner and outer protocols used TCP, retransmissions would stack on top of each other and cause severe performance degradation — a phenomenon known as TCP meltdown. By using UDP on the outside for delivery and relying on inner TCP for retransmission, WireGuard sidesteps this problem entirely.
Tailscale builds on top of WireGuard by adding a control plane — key distribution, NAT traversal, DERP relay, and so on. The tunneling behavior itself is identical to vanilla WireGuard, so all of WireGuard’s MTU characteristics apply to Tailscale as well.